Professional data visualization via ubisys dashboard.
Collect data and statistics about energy consumption, occupancy, brightness, temperature fluctuations, humidity, etc. in your building. The data is collected by sensors and visualized in the form of graphs and charts.

Responsive
Modern and responsive web UI
for desktop, phone and tablet.
Gateway G1
Dashboard is hosted on ubisys
Gateway G1.
Updates
More features in upcoming
revisions.
revisions.
Features

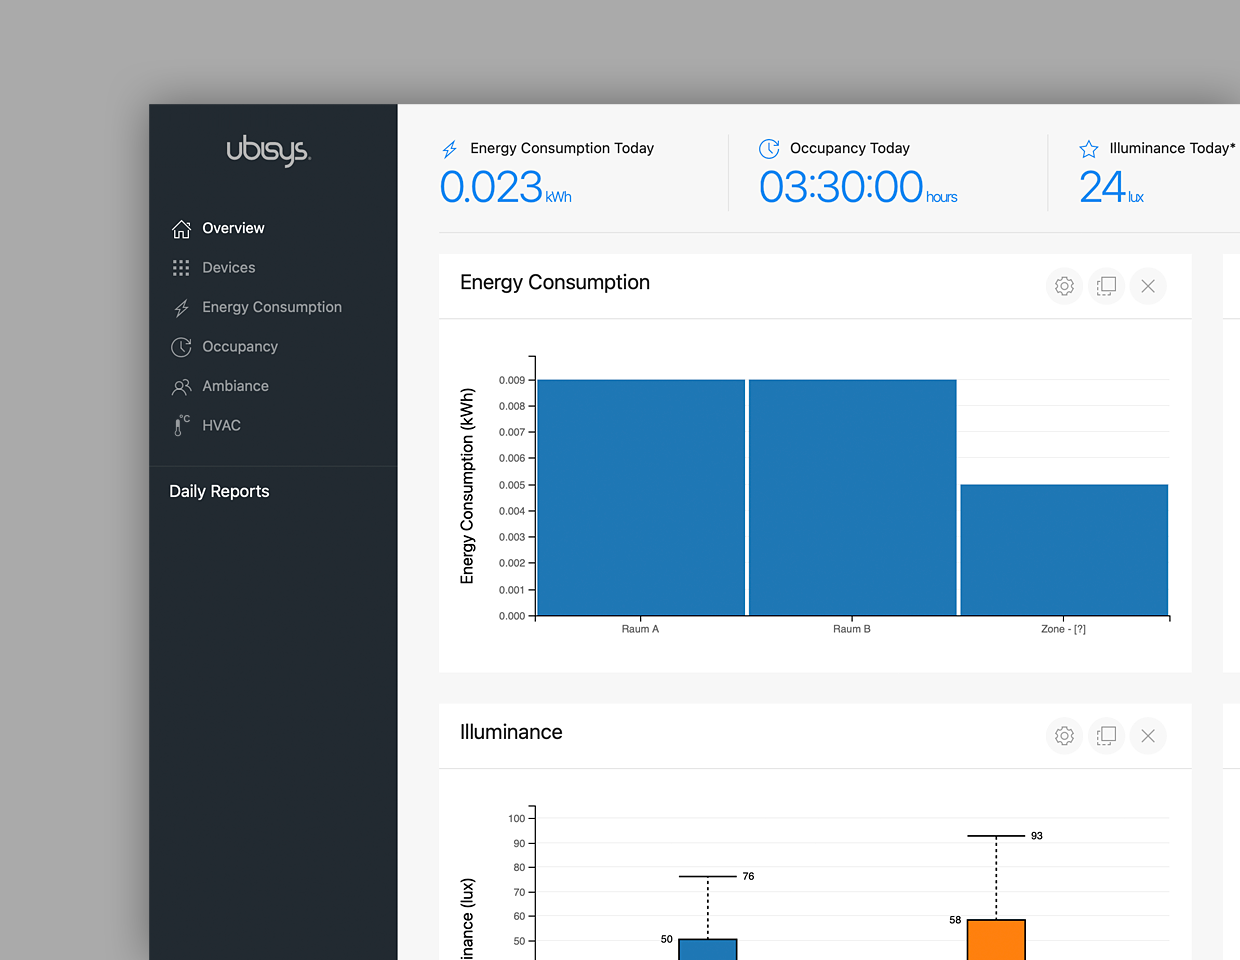
Overview Page
- Header with most important metrics for today: Energy consumption (since midnight), occupancy (since midnight), illuminance (during office hours, i.e. excluding night hours – timespan will be configurable in the future)
- Draggable tiles with high-level overviews
- For each tile, ability to select the time span taken into account for the data visualization in that tile: Last hour, today = since midnight, last 24 hours, last week (= last 7 days), last month (calendar month), last year (calendar year). Longer time frames (5 years, 10 years and max) will be added in upcoming revisions
- Tile: Accumulated energy consumption per room/zone as bar chart
- Tile: Accumulated occupancy per room/zone as bar chart (e.g. room x way occupied 120 minutes)
- Tile: Illuminance per room with min, max, average as box plot
- Tile: Temperature per room with min, max, average as box plot
- Tile: Humidity per room with min, max, average as box plot

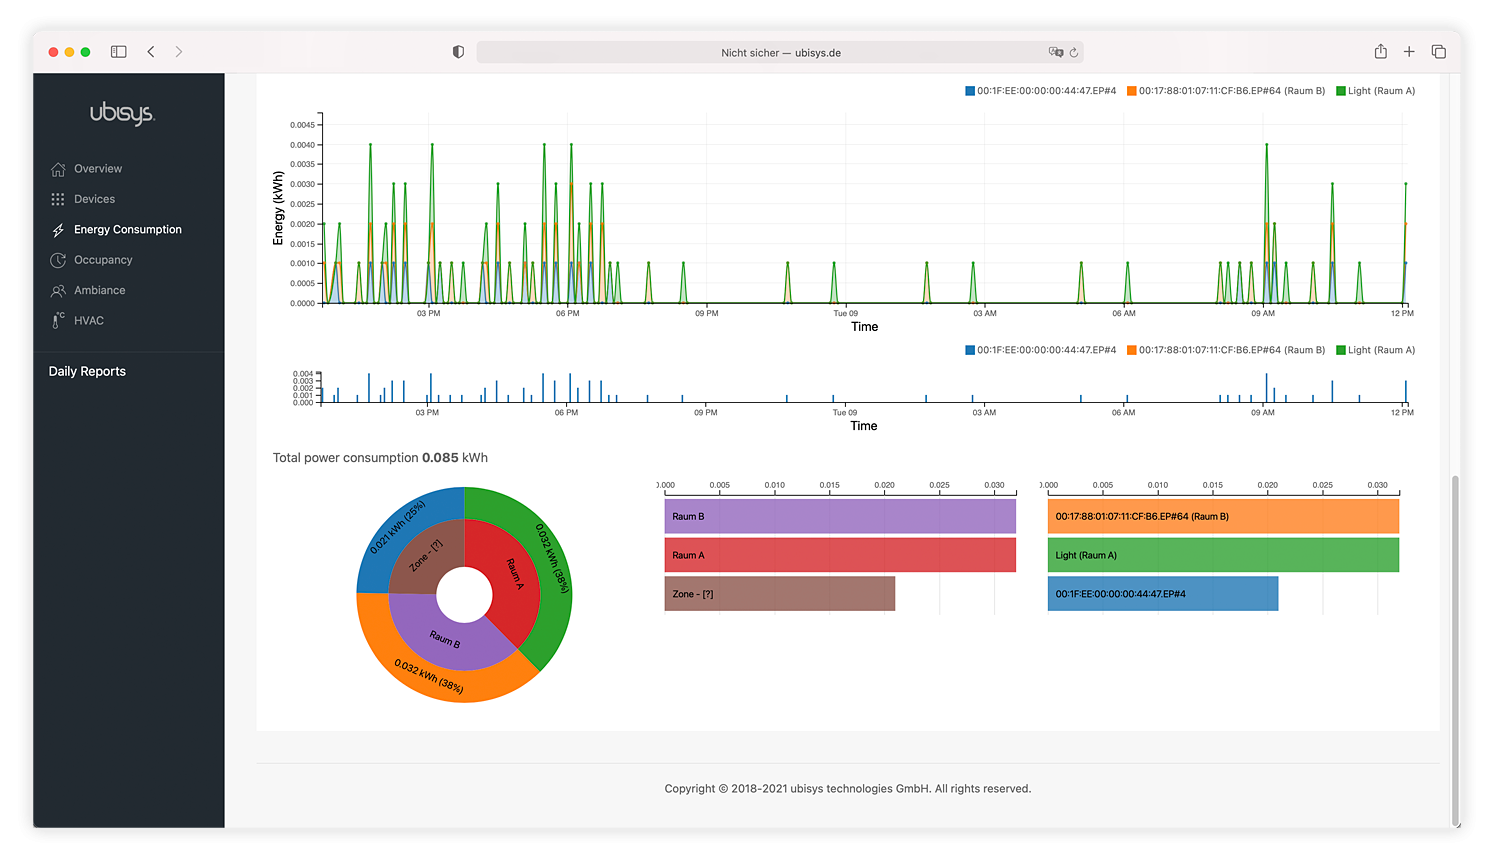
Energy Consumption
- Accumulated Energy consumption as time series chart for a select number of devices. By default, shows details for the 5 devices consuming most energy, user may select a different set of devices
- Stacked bar chart with energy deltas (when did devices consume energy?)
- Stacked area chart with energy deltas (same as above, slightly different depiction)
- Sunburst chart with inner ring = room and outer ring = device for the selected devices
- Ranking chart (devices ranked by consumption)
- Coarse time period selector (same as on overview page)
- Fine grained time period selector (range slider) with interactive link to other charts on the page for the selected devices
- Total power consumption for selected devices and selected time period
Occupancy
- Occupancy in minutes per device
- Stacked bar chart with energy deltas (when did devices consume energy?)
- Stacked area chart with energy deltas (same as above, slightly different depiction)
- Pie chart with durations for the selected devices
- Ranking chart (devices ranked by occupancy duration)
- Coarse time period selector (same as on overview page)
- Fine grained time period selector (range slider) with interactive link to other charts on the page for the selected devices

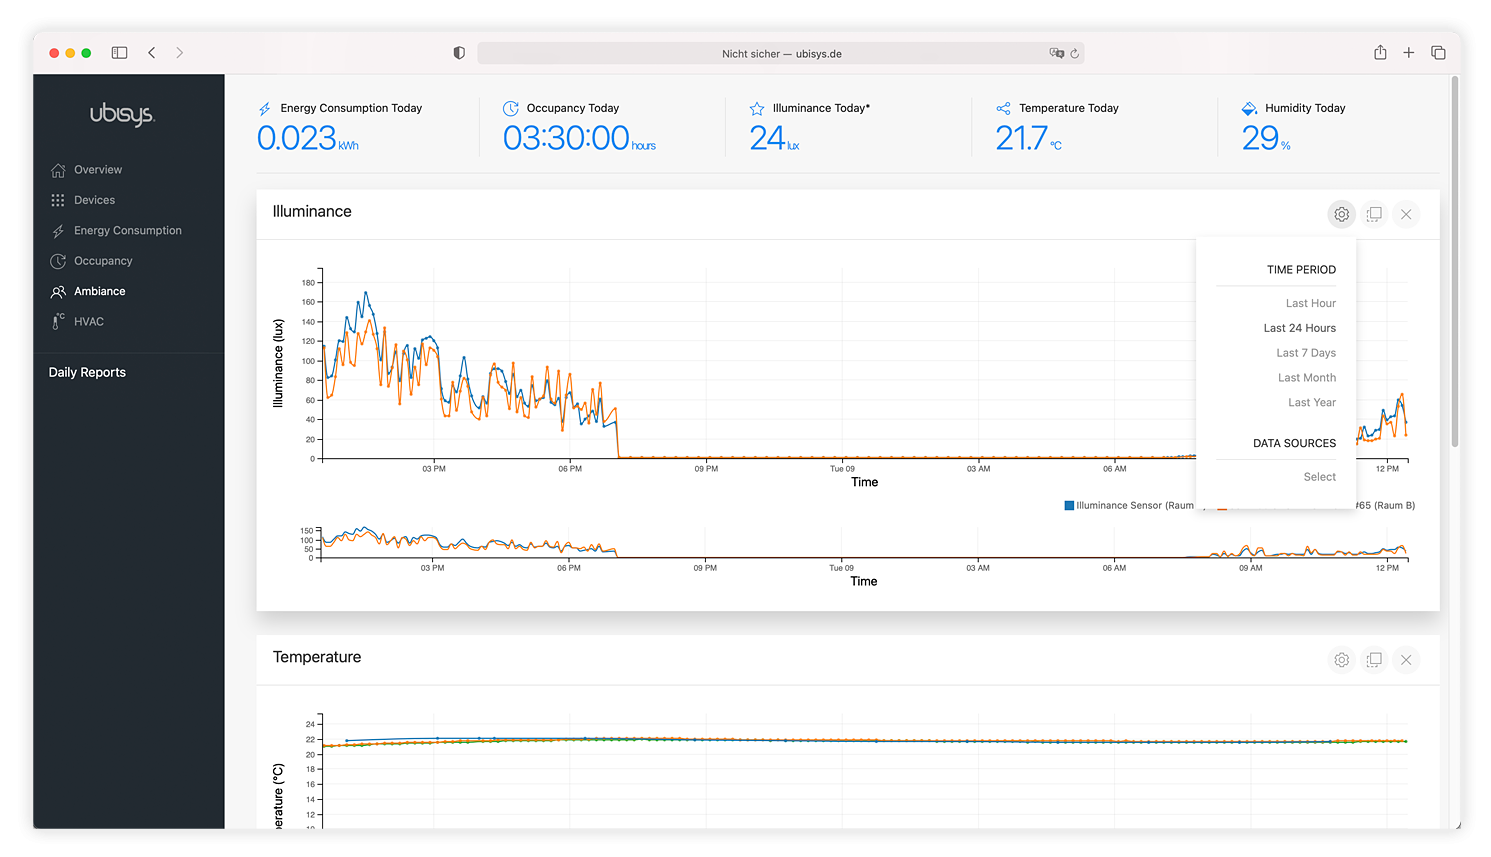
Ambience
- Illuminance as time series chart for select set of devices over select period of time
- Temperature as time series chart for select set of devices over select period of time
- Humidity as time series chart for select set of devices over select period of time
- Coarse time period selector (same as on overview page)
- Fine grained time period selector (range slider) with interactive link to other charts on the page for the
- Fine grained time period selector (range slider) with interactive link to other charts on the page for the
HVAC
- Heating and cooling demand as time series chart for select set of HVAC controllers over select period of time
- Coarse time period selector (same as on overview page)
- Fine grained time period selector (range slider) with interactive link to other charts on the page for the selected devices

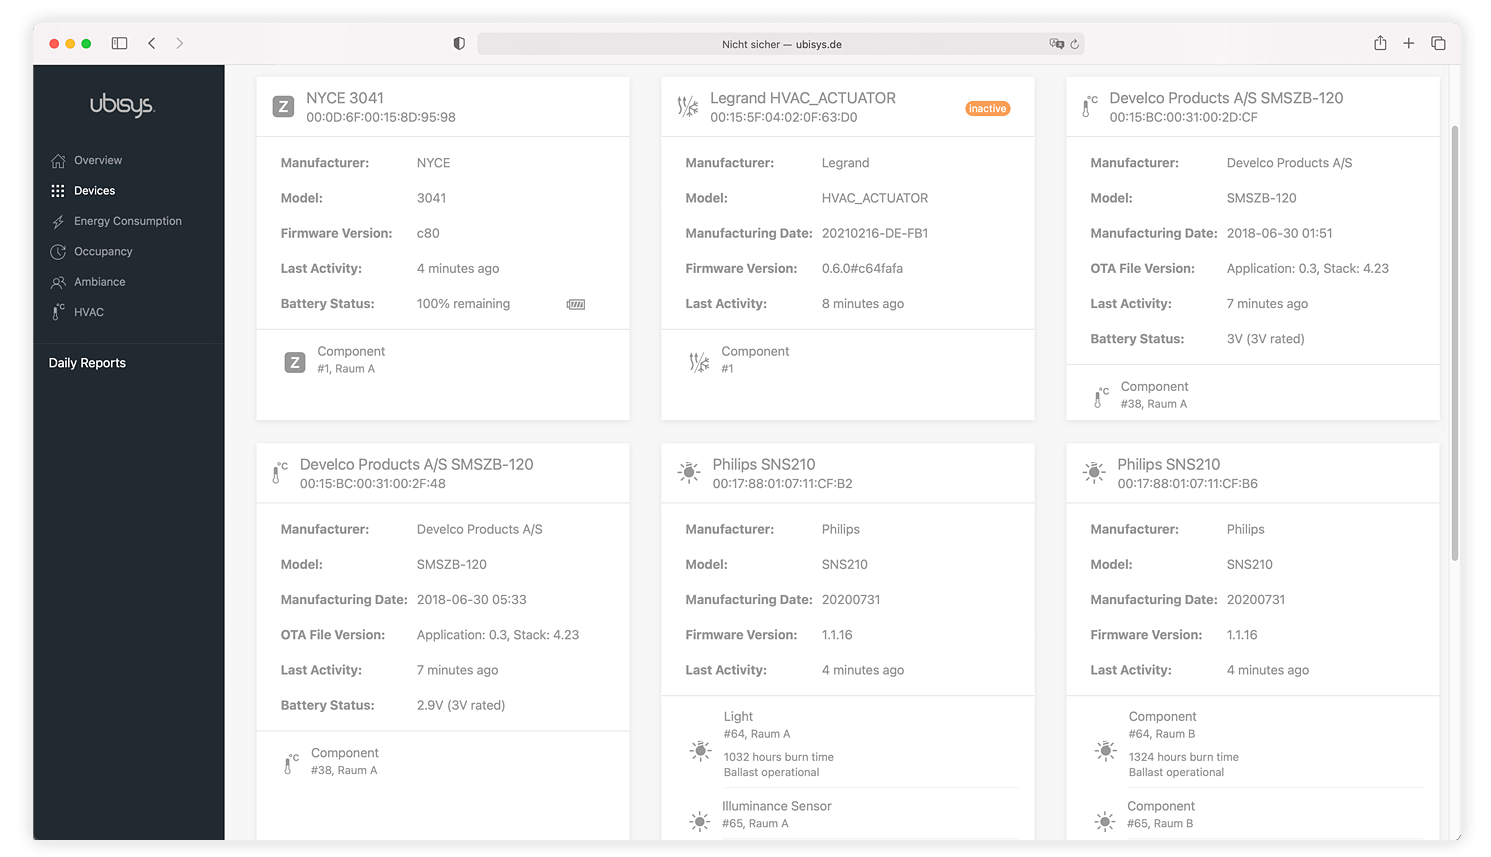
Devices
- Device health and Zigbee network connectivity monitoring (last activity, battery levels, etc.)
- Manufacturer, Model, Manufacturing Date, Firmware Version per device
- Break-down of application end-points relevant to the dashboard per device
- For endpoints with ballast configuration cluster: Display of lamp burn hours and ballast status (operational, failure)
